Task structure
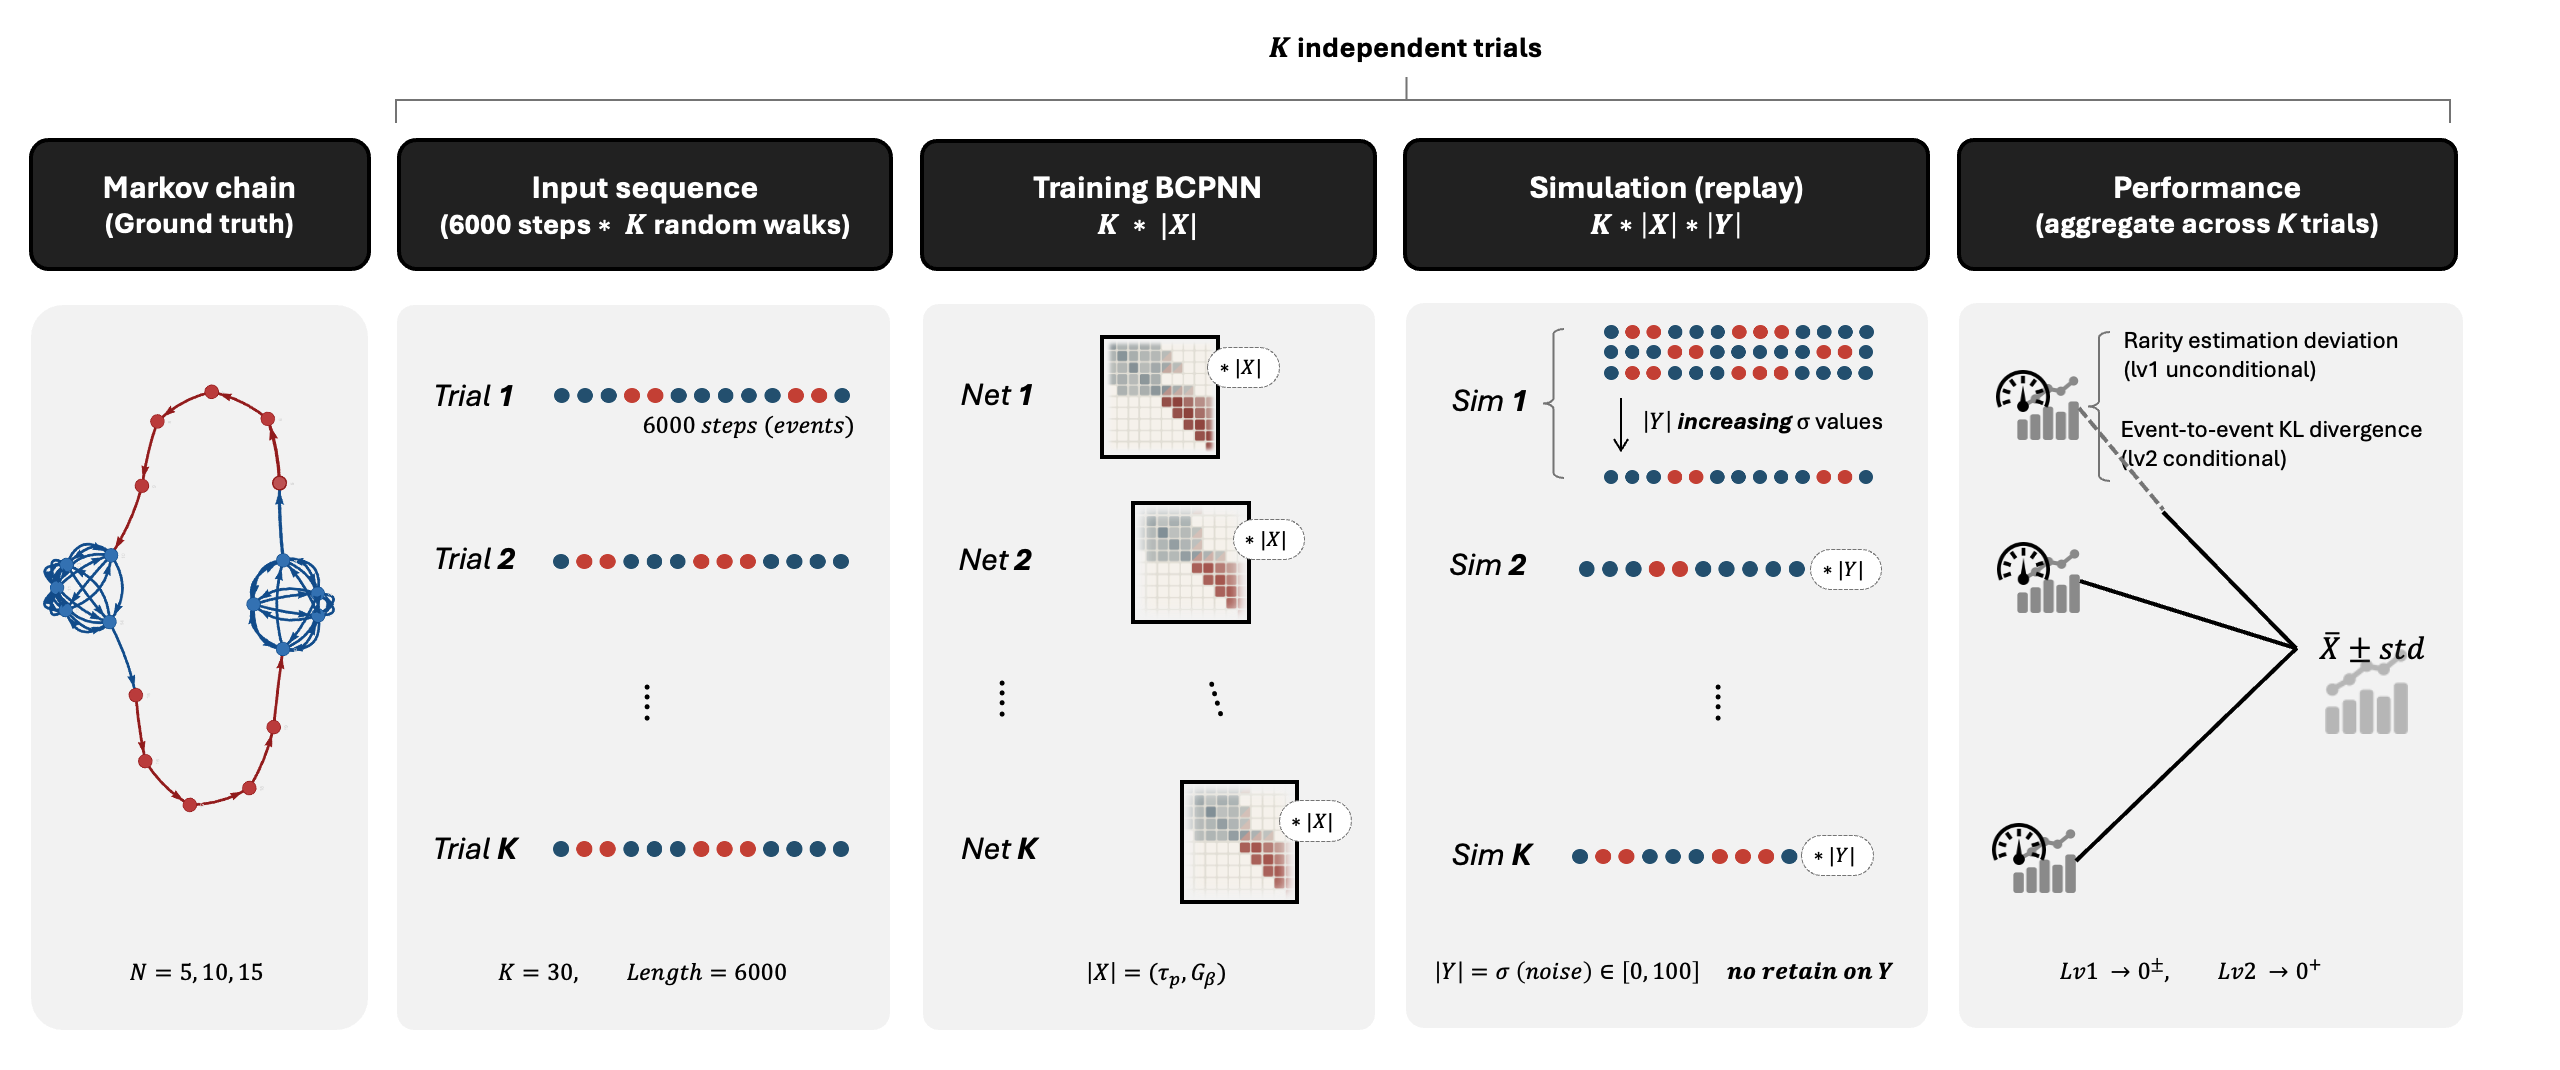
Common events form dense cliques; rare events sit on a sparse chain that links the cliques into one cycle. Use the chunk-size control that appears at the bottom of the screen while this block is in view to change how rare the rare events are.
 Chunk (size adjustable)
 Directed connectionsChunk (size adjustable)Directed connectionsChunk (size adjustable)Directed connections
Back to the write-up
Return to the Task design section of the results page, or scroll on to see how input sequences are generated from this chain.
Input Generation
How sequences are generated from the Markov chain, and how performance is measured.
Back to the write-up
Return to the Input generation section of the results page, or scroll on to the two simulation case studies.
Simulation
The internal model has been exposed to a limited set of input samples during training. After that, given a short random cue, the network begins to autonomously simulate, replaying what it has seen through its learned representation. However, this vanilla replay process has a problem. Looking at the rare-event estimation deviation, the model either over-estimates or under-estimates them. The question now becomes: how can we correct the estimation errors?
Continue reading
Back on the results page: what happens to these two cases as the noise level sweeps from zero to high, and how the other parameters behave.